Sound drives emotion. Emotion drives action. For brands and creators, translating that emotional pull into engagement—and ultimately sales—means finding a way to make audio visible. That’s where music visualizers come in. These dynamic tools transform sound into motion, giving marketers a visual way to connect audiences with the rhythm, tone, and mood of their message.
Why Music Visualization Works
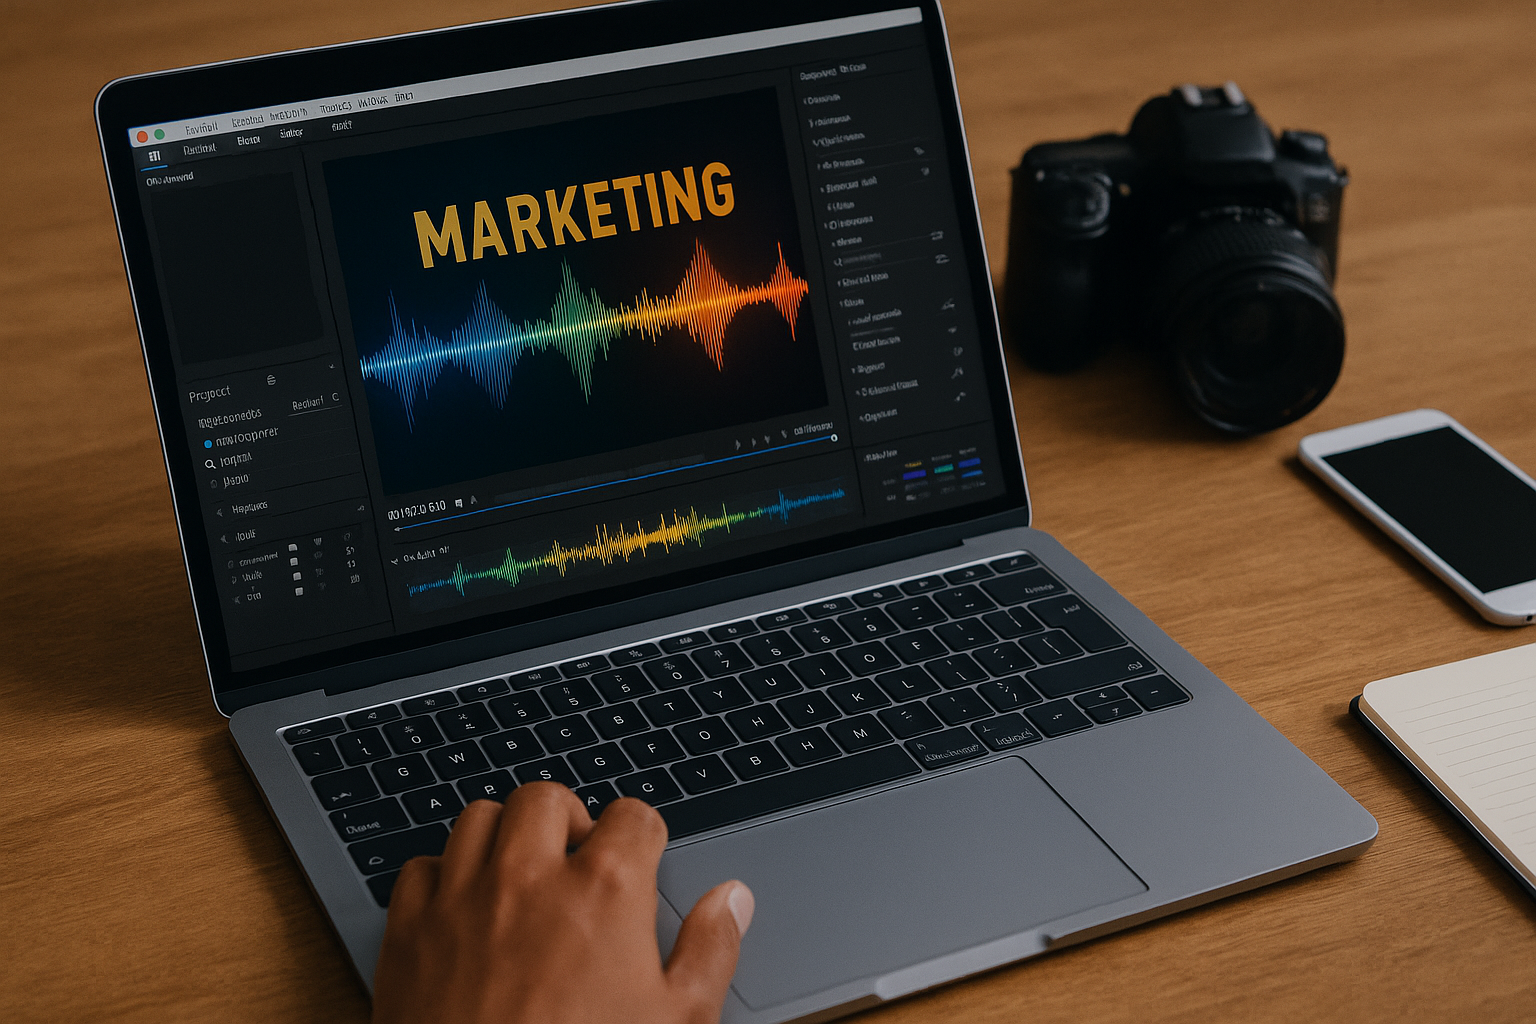
Humans respond to rhythm on a neurological level. Visualizing sound reinforces that connection, bridging auditory and visual processing. It’s why a pulsing waveform or reactive animation can make a podcast intro, product ad, or song teaser far more compelling than static imagery alone.
Music visualizers analyze frequency, amplitude, and tempo in real time, then translate those parameters into motion graphics. Low frequencies produce slower, heavier movements; highs create sharp, flickering visuals. The result is a living graphic that mirrors the energy of your track—instantly making your brand content more dynamic and memorable.
For businesses, this means one thing: higher retention. A 2023 HubSpot report showed that 54% of consumers want to see more video content from brands they support. Pairing visuals with sound ensures they stay longer, engage deeper, and remember the message.
The Technical Mechanics Behind Music Visualizers
A modern music visualizer isn’t just aesthetic—it’s data-driven motion. At its core is a process called audio spectrum analysis. Here’s how it works technically:
- Audio Input – The visualizer ingests a waveform, typically a WAV or MP3 file.
- Frequency Analysis – Fast Fourier Transform (FFT) algorithms break the signal into multiple frequency bands.
- Amplitude Mapping – Each band’s energy level is measured in decibels and mapped to a motion parameter (e.g., height, opacity, rotation).
- Visual Rendering – The system updates frame-by-frame, syncing movement to audio in real time or during rendering.
The sophistication lies in mapping. A good visualizer doesn’t just bounce to the beat; it translates emotion through form—slow gradients for ambient tones, sharp spikes for percussion, fluid shapes for melody.
These visualizations are rendered in formats like MP4, MOV, or WebM for easy integration into social media campaigns or websites.
Applications in Digital Marketing
Music visualizers used to be niche tools for DJs and musicians. Now, they’re powerful marketing assets. Businesses across industries like fitness, tech, fashion, and even finance use them to add energy and movement to audio-driven campaigns.
1. Product Launches
Pair a voiceover or soundtrack with reactive visuals during teasers or product videos. The audio-visual sync enhances message delivery and emotion.
2. Podcasts and Audio Ads
Static thumbnails limit engagement. Visualizers give listeners something to look at—boosting playtime and share rates on platforms like YouTube and Instagram.
3. Social Media Campaigns
Short visualizer clips formatted for Reels or TikTok create immediate motion in feeds. When optimized for vertical layouts, they double as micro-commercials.
4. Live Streams and Events
Brands use real-time audio visualization to create dynamic backgrounds for virtual events or product demos, adding visual rhythm to live broadcasts.
Choosing the Right Tool
Professional results don’t require a full production team. A YouTube audio visualizer tool automates the process while offering enough customization to match your brand identity.
Here’s what to look for technically:
- Codec Support – Ensure H.264 or H.265 output for web compression without losing quality.
- Resolution Options – Export in 1080p or 4K for crisp playback on large displays.
- Template Flexibility – Choose adjustable color palettes, shapes, and animation speed.
- Audio Reactivity Control – Fine-tune the intensity of motion based on amplitude thresholds.
- Render Time Efficiency – Cloud rendering saves CPU resources and speeds up turnaround.
For marketers, these platforms bridge creativity and efficiency. Tools like Videobolt allow you to sync your music, customize branding, and render visualized videos directly optimized for YouTube, TikTok, and other channels.
Integrating Visualizers into Marketing Workflows
Think of a visualizer as part of a layered content strategy. Don’t just use it as decoration—use it to amplify storytelling.
Workflow Example:
- Import your brand’s jingle or soundtrack.
- Customize a motion template aligned with brand colors.
- Add logo animation synced to key beats.
- Export and embed into ad creatives or landing pages.
Use data from viewer retention analytics to test variations. A slower waveform may fit corporate messaging, while a rapid one suits upbeat promotional material. The technical flexibility of a good visualizer lets you adapt quickly based on campaign performance.
Measuring Impact
Music visualization enhances both watch time and conversion rate because it activates dual sensory engagement. The viewer hears, sees, and feels your message. This sensory layering increases the likelihood of recall.
Run A/B tests on campaigns with and without visualization to measure click-through and retention metrics. Brands often report higher engagement rates when sound-reactive visuals accompany their videos.
For instance, campaigns using animated waveforms on YouTube thumbnails tend to outperform static images, driving curiosity and playback.
Conclusion
Music visualizers translate sound into sight, emotion into interaction, and rhythm into sales. They bridge the gap between audio marketing and visual storytelling, turning a simple track into a kinetic experience that audiences remember.
Whether you’re a musician promoting a release, a podcaster building audience loyalty, or a brand pushing digital ads, the power of sound-reactive design is undeniable.
To start, use an audio visualizer. A tool that merges automation with design precision. It’s fast, customizable, and built for creators who understand that every beat can be a marketing opportunity.
Sound is fleeting. Visuals are lasting. Together, they sell.